


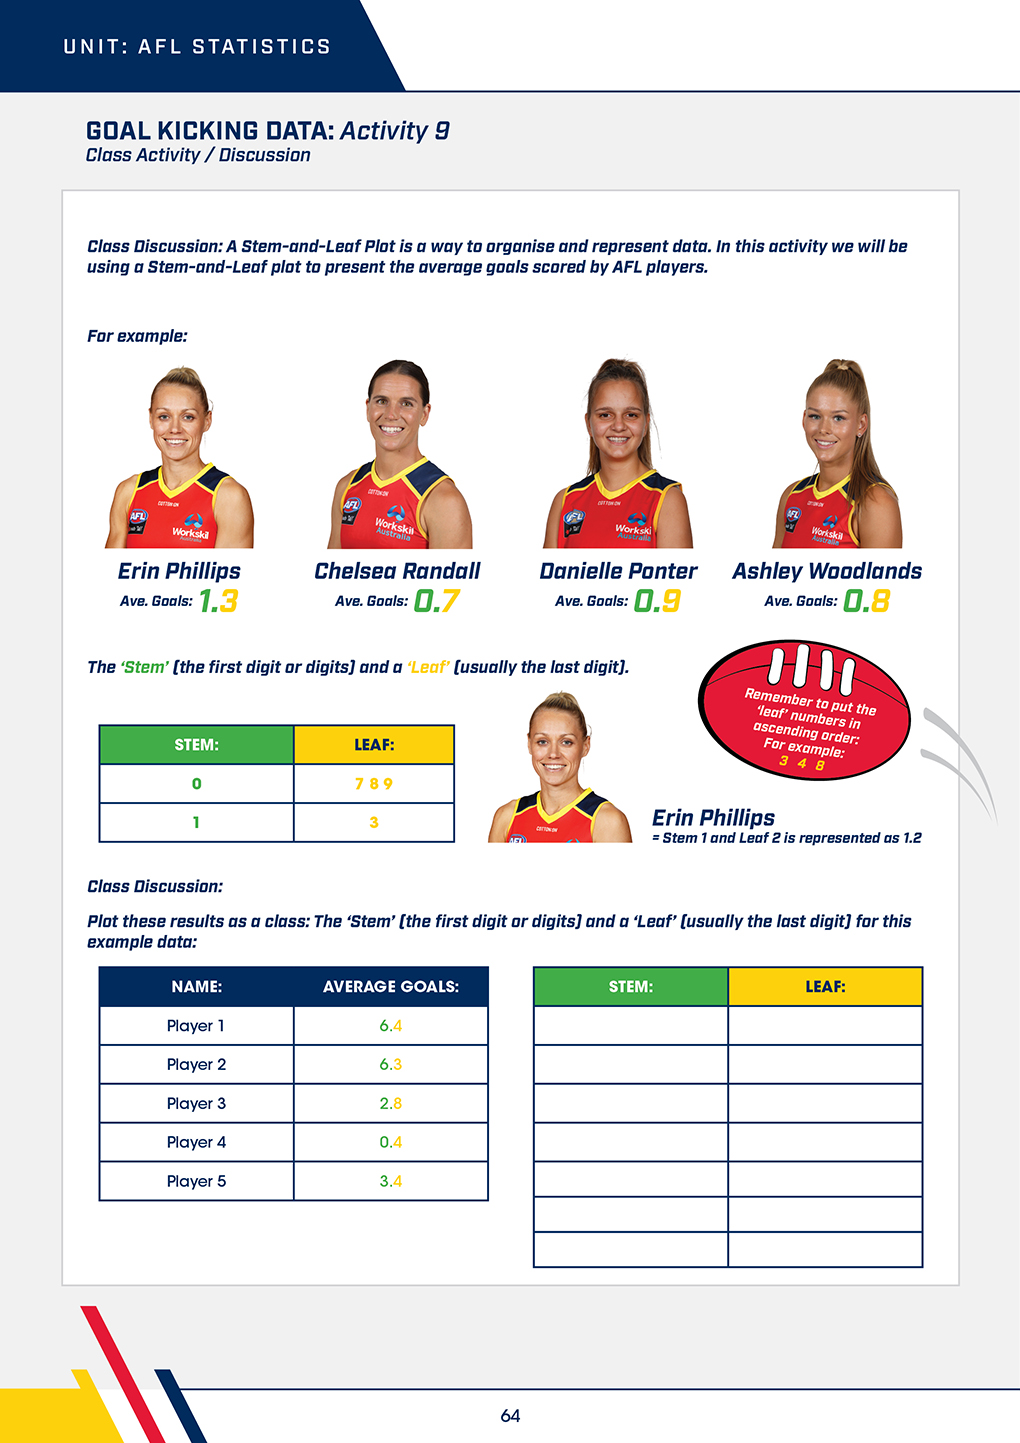
GOAL KICKING DATA: ACTIVITY 9
Class Activity / Discussion
Class Discussion: A Stem-and-Leaf Plot is a way to organise and represent data. In this activity we will be using a Stem-and-Leaf plot to present the average goals scored by AFL players.
For example:
 Stevie-Lee Thompson
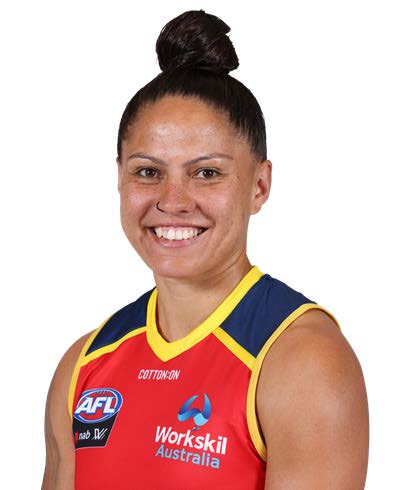
 Caitlin Gould
 Danielle Ponter
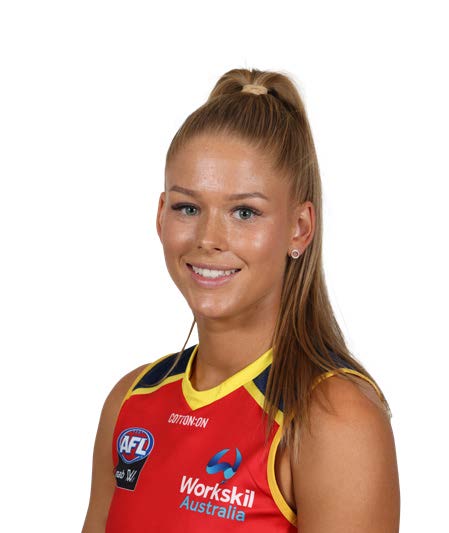 Ashley Woodland
The 'Stem' (the first digit or digits) and a 'Leaf' (usually the last digit).
| STEM: | LEAF: |
|---|---|
| 0 | 7 8 9 |
| 1 | 3 |
Ashley Woodland
= Stem 1 and Leaf 8 is represented at 1.8
Class Discussion:
Plot these results as a class: The 'Stem' (the first digit or digits) and a 'Leaf'(usually the last digit) for this example.
| Name | Average Goals |
|---|---|
| Player 1 | 17 |
| Player 2 | 15 |
| Player 3 | 17 |
| Player 4 | 14 |
| Player 5 | 19 |
| STEM: | LEAF: |
|---|---|
GOAL KICKING DATA: ACTIVITY 9
Exploration Task
As a class calculate the goal kicking average (mean) from the top 10 AFC 2018 Men's goal kickers list to 1 decimal place
|
PLAYERS
(Top 10 AFC men's) |
GAMES PLAYED IN 2020
|
GOALS
(Total 2020) |
AVERAGE GOALS
(Per Game) |
|---|---|---|---|
| TAYLOR WALKER | 17 | 48 | |
| SHANE McADAM | 15 | 25 | |
| DARCY FOGARTY | 17 | 24 | |
| RILEY THILTHORPE | 14 | 18 | |
| JAMES ROWE | 19 | 15 | |
| BEN KEAYS/td> | 22 | 12 | |
| PAUL SEEDSMAN | 22 | 12 | |
| NED MCHENRY | 21 | 11 | |
| HARRY SCHOENBERG | 22 | 10 | |
| LACHLAN MURPHY | 15 | 9 |

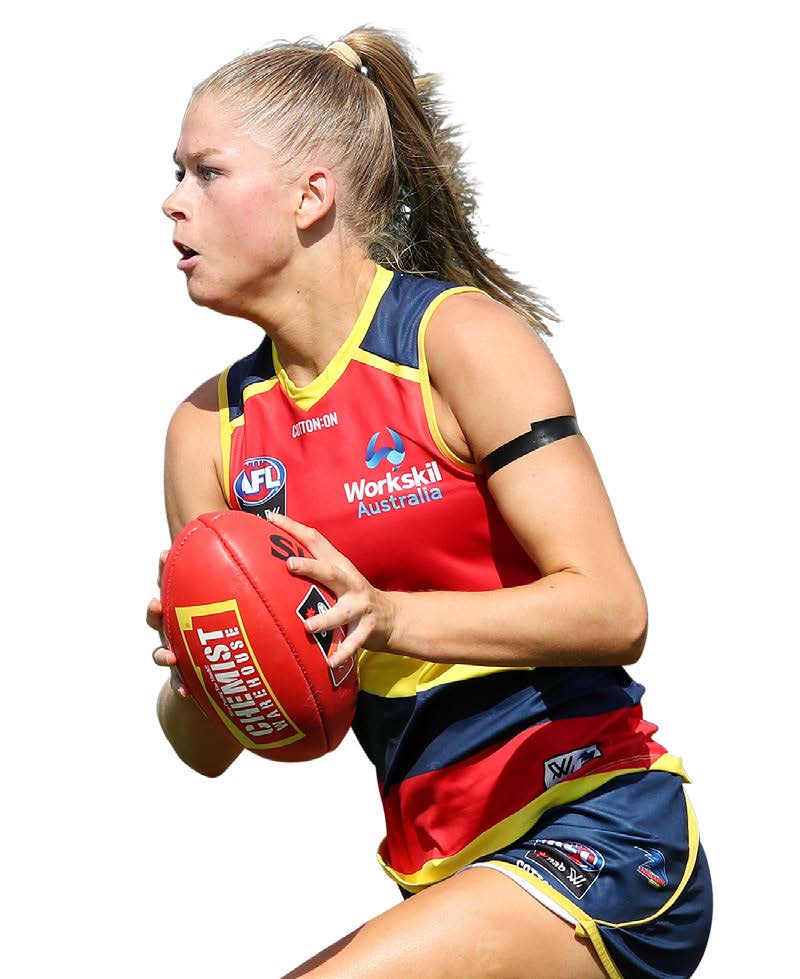
Taylor Walker
2020 Goals:
48
As a class plot them on a
'Stem' (the first digit or digits) and a
'Leaf'
(usually the last digit) graph:
For example: If the average goals for AFL were 2.3,
the stem will be 2 and
the leaf will be 3.

Shane McAdam
2020 Goals:
25
| STEM: | LEAF: |
|---|---|
| 2 | 3 |


GOAL KICKING DATA: Activity 9
Exploration Task)
Calculate the goal kicking average (mean) from the top 10 AFC 2019 Women's goal kickers list to 1 decimal place.
|
PLAYERS
(Top 10 AFC women's) |
GAMES PLAYED IN 2019
|
GOALS
(Total 2019) |
AVERAGE GOALS
(Per Game) |
|---|---|---|---|
| ASHLEIGH WOODLANDS | 12 | 21 | |
| DANIELLE PONTER | 11 | 8 | |
| CAITLIN GOULD | 11 | 5 | |
| LISA WHITELEY | 6 | 4 | |
| STEVIE-LEE THOMPSON | 10 | 4 | |
| RACHELLE MARTIN | 12 | 3 | |
| ANNE HATCHARD | 12 | 2 | |
| ELOISE JONES | 10 | 2 | |
| AILISH CONSIDINE | 10 | 2 | |
| EBONY MARINOFF | 12 | 1 |
Ashleigh Woodland
2022 Goals:
21
As a class plot them on a
'Stem' (the first digit or digits) and a
'Leaf'
(usually the last digit) graph:
For example: If the average goals for AFL were 2.3,
the stem will be 2 and
the left will be 3.
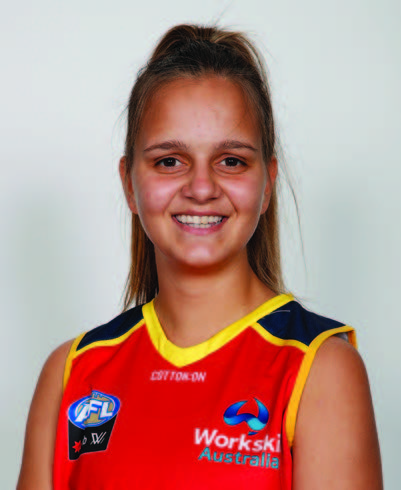
Stevie-Lee Thompson
2019 Goals:
14
| STEM: | LEAF: |
|---|---|
GOAL KICKING DATA: Activity 9 (Extension / Group Work Challenge)
When there are two sides or groups, we can use a two-sided Stem-and-Leaf plot.
Here is an example of a two-sided Stem-and-Leaf Plot.
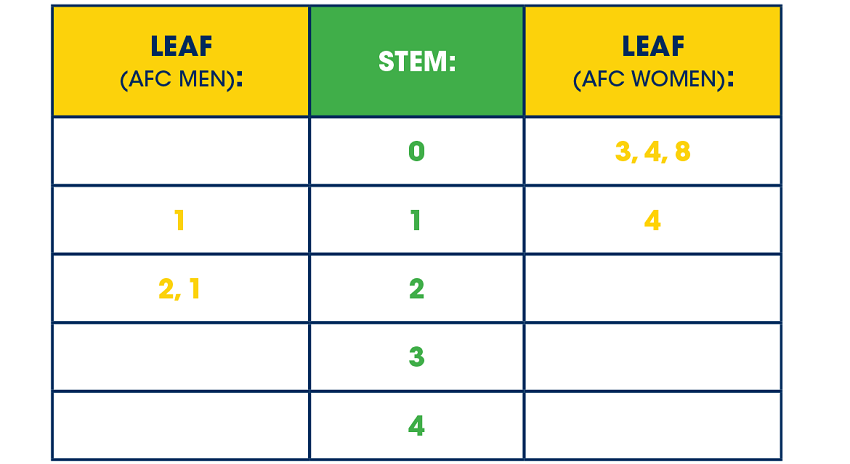
Using your results from the first activity, create a Stem-and-Leaf plot comparing the ACL Men's (AFL) average goals to the AFC Women's (AFLW) average goals (Round to one decimal place).
|
LEAF:
(AFC MEN) |
STEM: |
LEAF:
(AFC WOMEN) |
|---|---|---|